3.1 KiB
| description |
|---|
| Learn how to use basic math and a simple spreadsheet to estimate your Passive Rewards APY and get deeper into Active Rewards APY. |

K.I.S.S.
veOCEAN and your APY
Before we start, let's do a quick recap.
Rewards are earned by users that hold and use their veOCEAN to help the protocol improve and grow. Here are some good lessons to improve the outcome of your APY.
- To improve your yield, you will need to make good decisions for how long you'll choose to lock. The best way to do this is to learn how Time Locking and Linear Decay function.
- APYs are always initially calculated by dividing the amount of OCEAN you have received from rewards, by the relative amount of OCEAN you have locked up.
- As a rule: Wherever APYs are provided to the user in the app (df.oceandao.org), they are caclulated assuming an initial 4-year lock up period with a weekly schedule of compounding rewards into an updated 4-year lock. This estimate works provided current: number of users, reward emissions, and other reward parameters stay constant while excluding all tx fees.
Now that we got that out of the way, let's work through the examples and keep it as simple as possible.
Estimating Passive APY
To make it easier to estimate your APY, we have created a simple spreadsheet that let's you easily estimate your Passive APY.
We have provided 2 sheets as an example of locking-up 10,000 OCEAN for:
- A 4-year investment period
- A 6-mo investment period
The above are simplified examples meant for everyone to understand. They are naive investment strategies and are meant to provide you, the reader, with some examples to build upon. You can use these as a reference to create your own plan, so feel free to make a copy of this spreadsheet and customize it to your needs and wants.
Estimating Active APY
Active Rewards are a bit more complicated and depend on many factors that are currently hard to predict accurately. It is unlikely for the user to get a practical result, which is why we don't offer a tool to estimate Active APY right now.
You can easily expand the spreadsheet above to support basic, naive calculations for Active Rewards such as defining a constant percent yield per week.
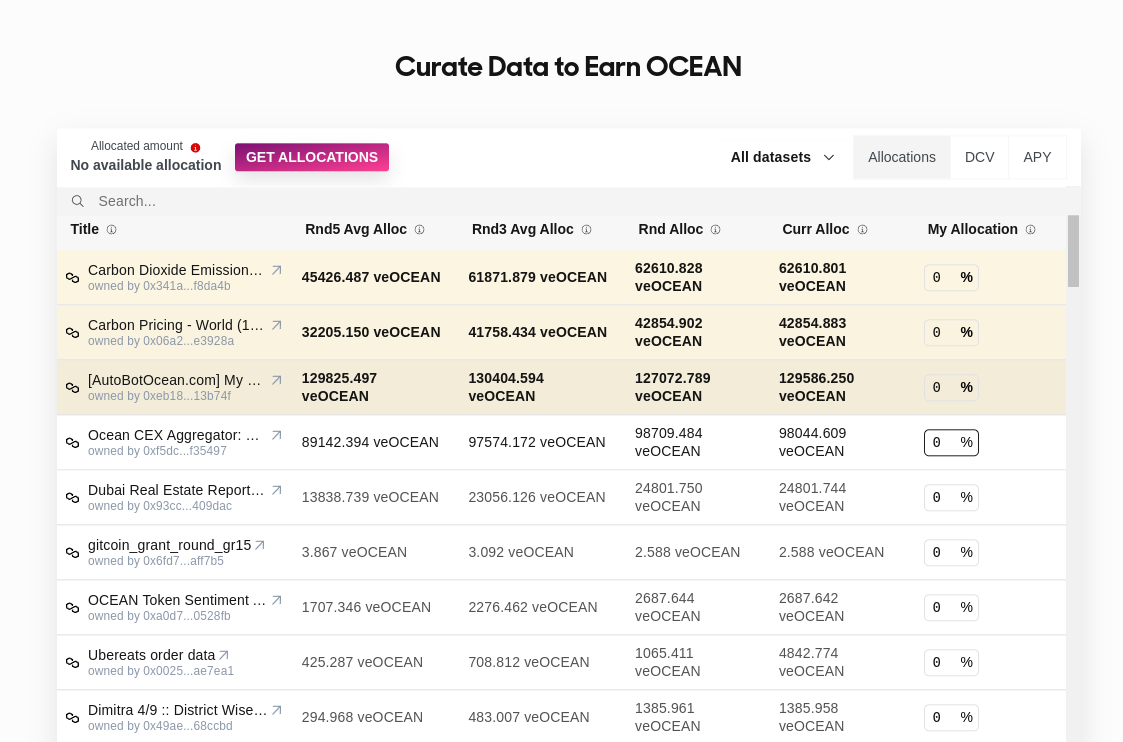
Having said this, we do provide a thorough dashboard that provides historical and ongoing summaries of APY, Data Consume Volume, and veOCEAN allocations per-round.

Curate like a Pro.
You can also learn how rewards are calculated here to understand more about what's happening behind the scenes of each Data Farming round.
Finally, you can review the implementation inside df-web to understand how APYs are calculated at the frontend/UI level.